Modelling load distribution
- Processes, standards and quality
- Technologies
- Others
One of the challenges we face during the performance test design is determining the load we should use. By the load here, I mean a number of concurrent users performing certain actions in System Under Test (SUT). Obviously, depending on the type of performance test applied, the load will alter, as we are testing system in search of different class of problems. This article attempts to describe the case in which we will try to simulate the anticipated high traffic in the SUT. This should be considered as a regular requirement for vast majority of load tests.
Case 1: Detailed information provided
In a perfect-world situation, we are able to obtain all the information required on the SUT load in live environment. For example, in case of a web application, we could get data from Google Analytics (for production site, of course!), which provides just about enough information on the number of users (including unique visits), hours of visits, time spent and many more. As we have accurate data, all we need to do is to adjust the load in our test, so that the real traffic in certain period of time was reflected correctly.
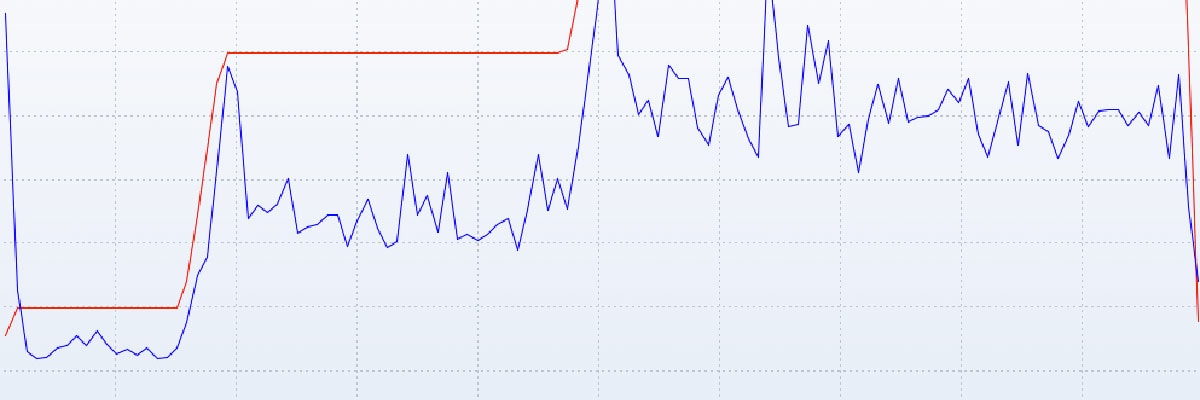
One could ask a question here: OK, so should my load test copy the load over time from live environment? The answer is obviously no. The aim of load test is to measure the performance of SUT under a defined load, so the time required for test would be usually shorter. On the other hand, it shouldn’t be too short, as we may capture the dynamic aspect of our system (e.g. one-minute peak in response times after the users log in) instead of the steady state we’re really interested in. To cut the long story short: the proper load test time should allow tested system achieve its steady state. That’s, by the way, the reason why ramp-up load is so popular in performance testing. An example of system reaching its steady state after initial ramp-up period is shown in the pic. 1.
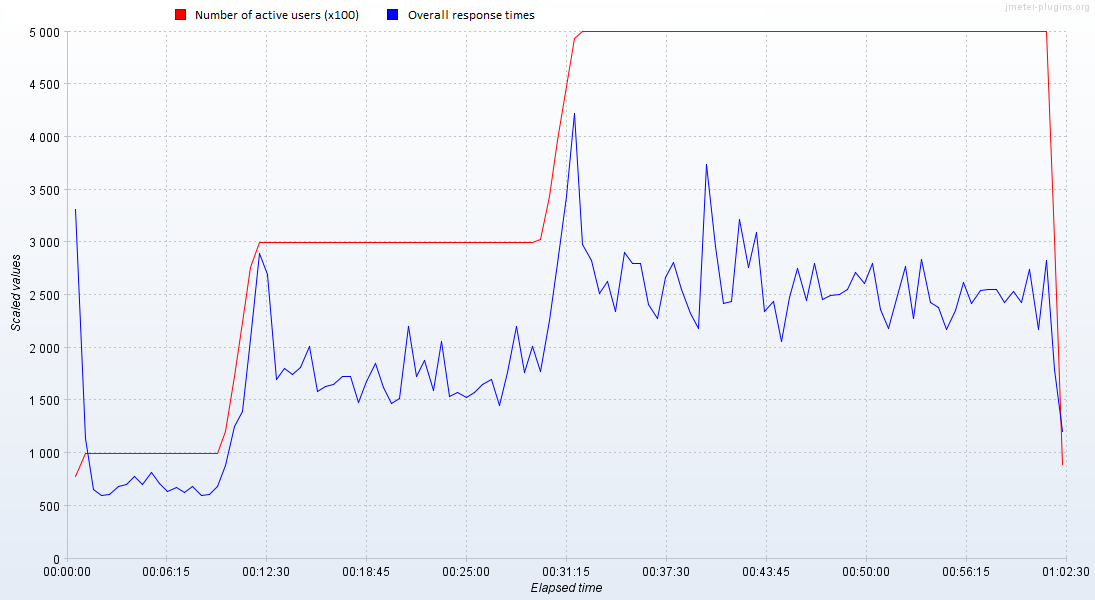
Picture 1. Example of performance test results. Peaks in response times during followed by a steady state can be noticed.
Case 2: Basic information provided
Another approach would be required in less-than-perfect world, when the data that we can get on the system usage are, at best, partial. Sometimes, the reason may be flawed communication, sometimes the data may simply be unavailable, e.g. before the system goes live.
What should we do then? We may only define some basic performance requirements (or receive a general anticipation), make some assumptions on the system usage and again – gather as much info as possible.
In this case, we may often find ourselves in situation, when we get too general information instead of what we really need. Getting it more precise: we may receive the information that traffic in our system may be approx. 20,000 users’ actions per month (let it be whatever you need, e.g. sending an email from web mail application). In fact, we get a certain number that is absolutely unusable for the purpose of our test, which usually takes a few hours. But if we work it out, we may end up with something more satisfactory. We just need to answer a few questions.
- Where are our users? Are they in one country? In one time zone? Or maybe they’re spread worldwide?
- This can easily give us an insight if our system will be used 24h or maybe the traffic will have some peaks.
- Do our users use this application at work? If yes, what hours do they work? This one may be just more informative for determining the load distribution throughout a day.
- What is the standard use case of our system? Will user perform his action once only (e.g. creating a report) or is it repeatable action (e.g. logging a defect in a bug-tracking system)?
- Does our system cause some traffic peaks by its design? For example, a registration for an event starting at 1 p.m. with a crowd waiting just to be the first? Or maybe all employees logging in at the beginning of a day?
After answering these questions, we may find out some dependencies that should be useful.
Let’s continue with the case above – 20,000 user actions per month. The application handles only users from certain country or time zone and it’s basically used at work in usual office hours, that is 9 a.m.-5 p.m. The users usually perform their action once only, as the system is used to log daily work time.
It allows us to assume that at least major part of traffic will happen just in eight hours. Then, we end up with about 20 working days per month, which give us 1,000 user actions per day. Here comes the question about the distribution of this traffic in time. Will it happen only during the working hours? That sounds improbable. So, during the working hours, will it be distributed uniformly? Again – rather not. Here, we should make another assumption. It is quite safe to say that in this case, when so many variables are unknown or at least uncertain, our load may have a normal (i.e. Gaussian) distribution in time. Given that vast majority of traffic will happen during working hours, we may let these 8 working hours be our two-sigma interval. This means that about 96% of traffic will happen in this time. As a result of choosing the Gaussian distribution, we may also know that middle 4 hours will carry 68% of traffic. In our case, that is exactly 680 user actions in 4 hours, or 170 per hour. This may be well seen in the picture 2. The dark blue area on the plot represents the peak period of the day that the test will reflect and the light blue one marks the total interval of office hours.
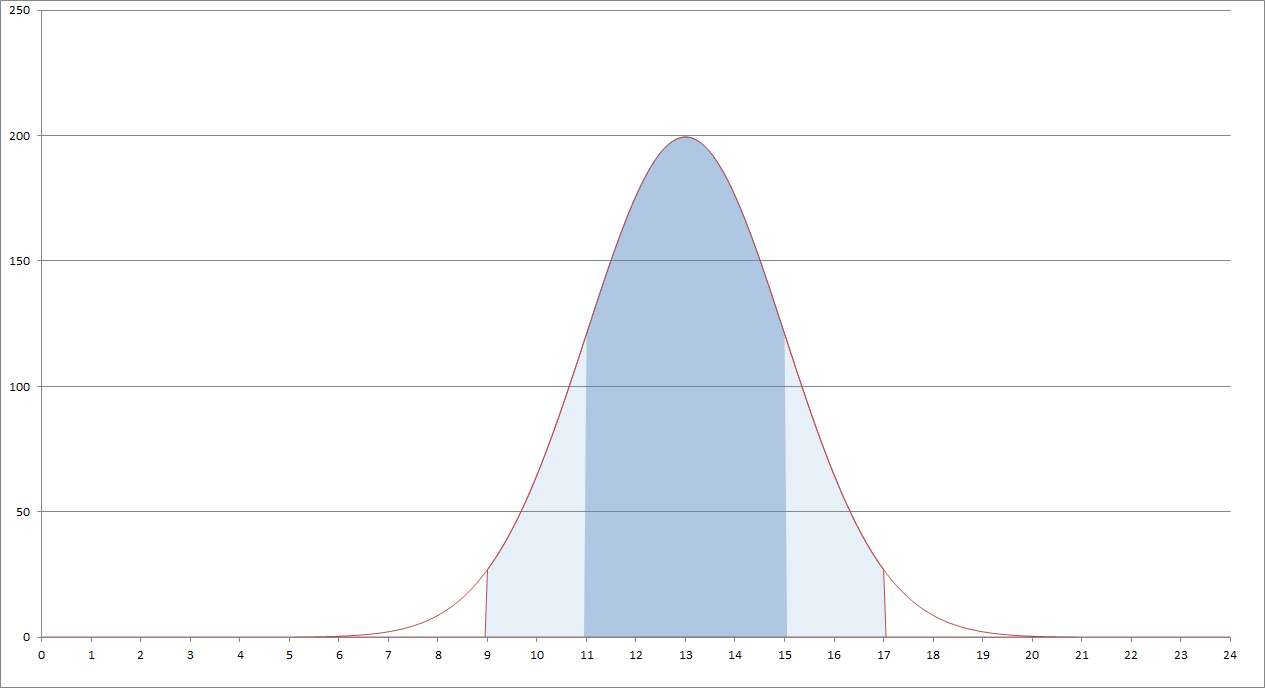
Picture 2. Load distribution throughout the day.
This may well be the end of our digressions. However, we need to keep in mind that this model is based on assumptions and needs to be verified against real data as soon as possible.
Conclusion
What we have achieved in the above mentioned examples is a simple way to process some pieces of information that are usually delivered as an input to performance tests into applicable test load. Obviously, this is only an example of what can be done. We may easily find a need to use different values or distributions. Nevertheless, the line of reasoning may always be the same.
Maybe you had some interesting experience in this matter? Don’t hesitate to share it in comments!