Software Estimation – PERT
- Processes, standards and quality
- Technologies
- Others
I would like to continue the topic of software estimation by presenting the technique of giving estimates commonly abbreviated as PERT.
Program Evaluation and Review Technique (PERT)
According to Wikipedia: '(…) a statistical tool, used in project management, that is designed to analyse and represent the tasks involved in completing a given project’.
One of the PERT’s elements is the way of estimating, based on three indicators: Optimistic, Pessimistic and Most Likely. On their basis an Expected Value and a Standard Deviation can be calculated. Those indices are commonly called PERT.
Formulas
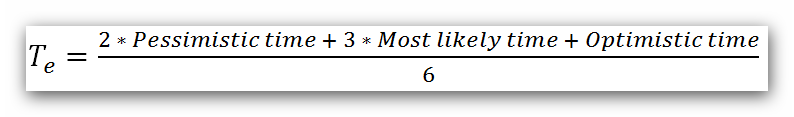
The Expected Value is a weighted average. Originally, Optimistic and Most Likely weights were equal, however putting it in practice showed that developers tend to be optimistic, that is why the weights are usually distributed in a following way:
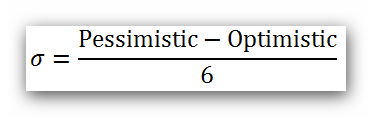
The Standard Deviation is calculated as follows:
PERT and Elementary Process
PERT is applicable to two different parts of an estimation procedure:
- Counting – three indicators for each problem are estimated and on their basis the Expected and Standard Deviation are calculated
- Reconstruction – nominal values are summed up, and a following standard deviation is assumed:

Enough theory – time for the example!

Statistics in use
Any calculable unit can be used in this technique. Using PERT we can estimate in hours, points, lines of code, amount of tables, etc.
How the estimation result should be read, providing that data from the table are in hours?
Average (27h) and Deviation (2,6) are parameters of normal distribution:
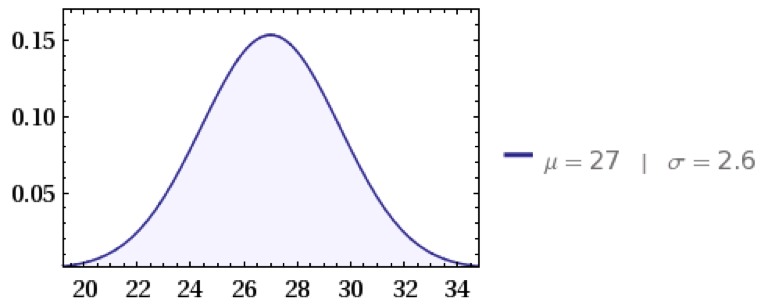
To estimate the possibility of accomplishing the project, e.g. within 30 hours, the following area has to be calculated:
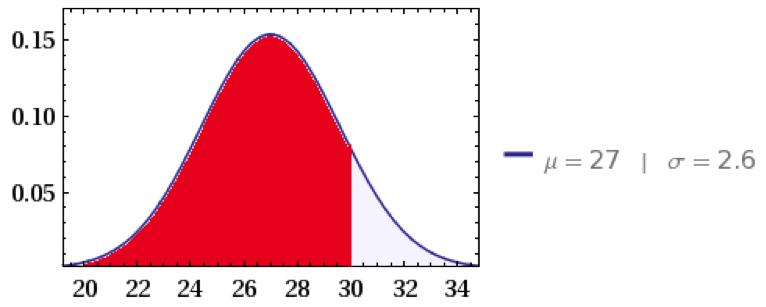
It can be easily done, using e.g. MS Excel NORM.DIST function. Called with parameters (30,27,2.6,TRUE) results in 0,875718, which means that probability of accomplishing the project within 30 hours (or less) equals 88%. Whereas the probability of finishing the project, e.g. within 24 hours equals only 16%.
The advantages of using PERT:
- With a low mark-up it enforces taking into consideration not only the 'happy path’, but also possible problems, or mistakes
- At the very beginning we get two numbers: Expected Time and an Error. They reflect estimates in a much better way than only one number. Those values can be shown in two different ways, as in the example above: 'on [possibility]% it is possible to finish the project in [x] [unit]’ or 'the project will close up between [µ] a [µ + σ] [unit]’. If you suspect that data, on the basis of which you estimated are strongly questionable, you can multiply σ by 2 or 3.
Using PERT is almost costless, however it significantly improves the quality of given estimates.